
Charts and Analysis
The ability to read and understand charts is what makes the difference between a good Forex trader and a great Forex trader. Radhai Investment have put together this breakdown of charts and analysis to help you improve your analysis techniques and improve your Forex trading returns.
There are several types of Forex charts. The most commonly used are the Line, Bar and Candlestick Charts. Regardless of what a chart may look like, the four variables tracked by any Forex chart are:
- Price
- Volume
- Time
- Momentum
Wedge
A Wedge Pattern is also very similar to a Symmetrical Triangle Pattern. The difference in this case is that a wedge drifts either upward or downward. In contrast, a Triangle Pattern tends to move to one side. Usually, a Wedge's full run unfolds over a three to six month period.
If you can find a trend like a Wedge during its early formative period, you can get in during a temporary rise or falling and make a decent profit. There are also abundant short-selling opportunities if you catch a Descending Triangle early enough.
There are 2 types of Wedges: Falling Wedge and Rising Wedge.
Falling Wedge. The Falling Wedge is generally a bullish pattern signaling that one will likely see the price break upwards through the Wedge and move into an uptrend. The trend lines of this pattern converge, with both being slanted in a downward direction as the price is trading in a downtrend.
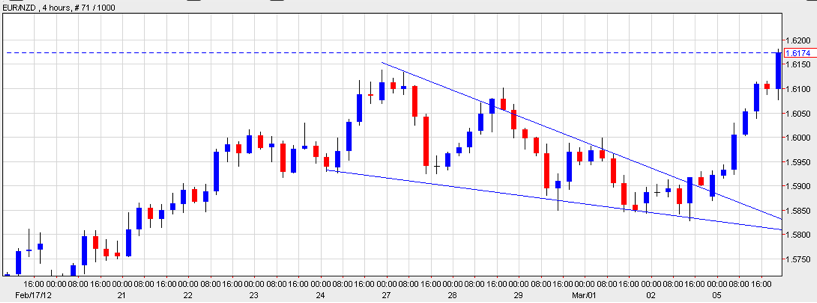
Rising Wedge. Conversely, a Rising Wedge is a bearish pattern that signals that the asset is likely to head in a downward direction. The trend lines of this pattern converge, with both trend lines slanted in an upward direction.
As the strength of the buyers weaken, the sellers start to gain momentum. The pattern is complete, with the sellers taking control of the security at which point the price falls below the supporting trend line.
Continuation Patterns
A Continuation Pattern is a brief change in the direction of a trend that ultimately returns to its original direction. Often, a continuation pattern comes about during a highly volatile period such as a natural disaster or a major election. Ultimately, market sentiment and the underlying strength or weakness of a currency win out and the overall trend continues unabated.
The following are the major types of continuation patterns.
Triangle
A Triangle is very common, especially on short term time frames.
There are three types of triangles; Ascending Triangles, Symmetrical Triangles and Descending Triangles. Triangles occur when prices converge with the highs and lows narrowing into a tighter and tighter price range.
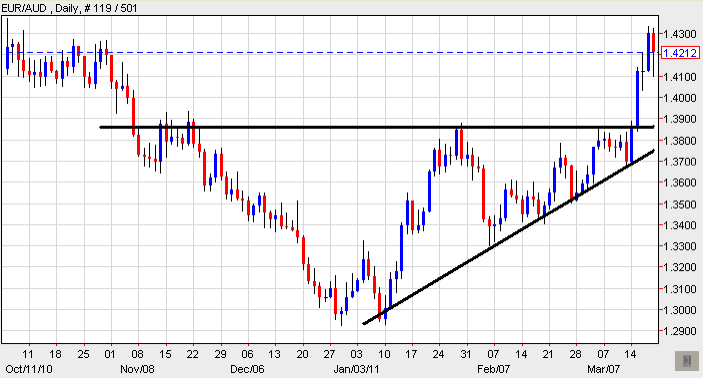
Ascending Triangles. An Ascending Triangle happens when a pair has been consolidating upwards. In the image below, the EUR/AUD pair had a resistance level near 1.39, which it couldn't pass. The support level had been rising, showing buyer's pressure. Eventually the pair broke upwards above the resistance level of 1.39. Ascending Triangles usually break through the resistance level.
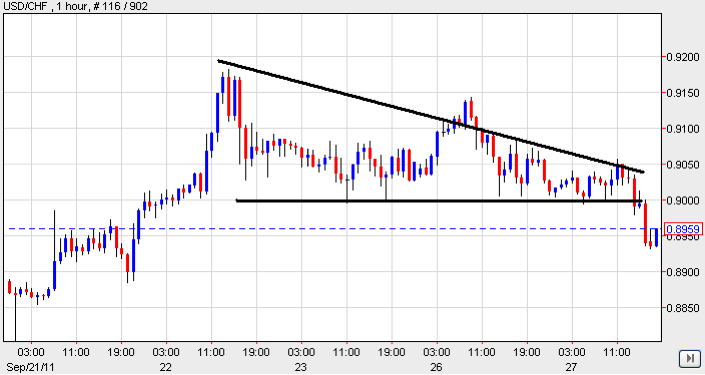
Descending Triangles. A Descending Triangle happens when a pair has been consolidating downwards. In the image below, the USD/CHF pair had support near the 0.90 level, which it couldn't pass. The resistance level had been declining, indicating seller's pressure. Eventually the pair broke downwards below the support level of 0.90. Descending Triangles usually break through the support level.
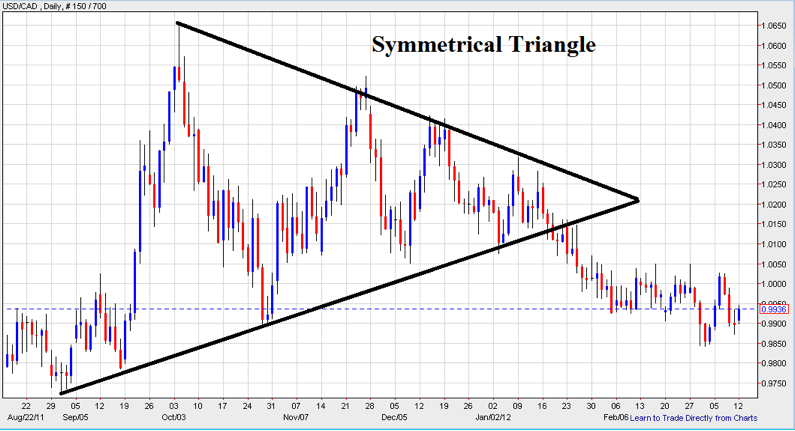
Symmetrical Triangles. The Symmetrical Triangle chart pattern is formed when highs and lows converge together to form a triangle shape. This is a standoff with the buyers and sellers. The Symmetrical Triangle pattern is considered a consolidation pattern.
OPEN AN ACCOUNT
Get up to 5000 thousand
Welcome Bonus
Simple & Free
Test your trading
skills in a risk-free
environment.
ACCOUNT ENQUIRY HERE